per year from 1989-1995
Captures by year 1989 to present - Text
only version
Total Captures 1989 to 1995 sorted into spring and fall
- Tables
Version or Text
Only Version
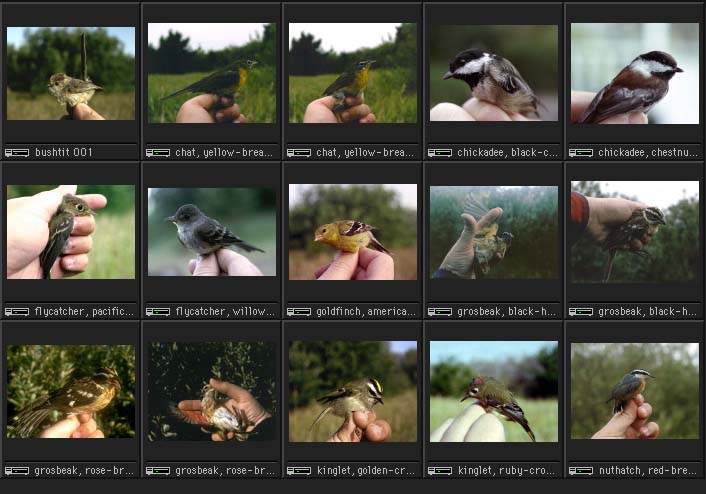
Photo
Album 01-bushtit to nuthatch
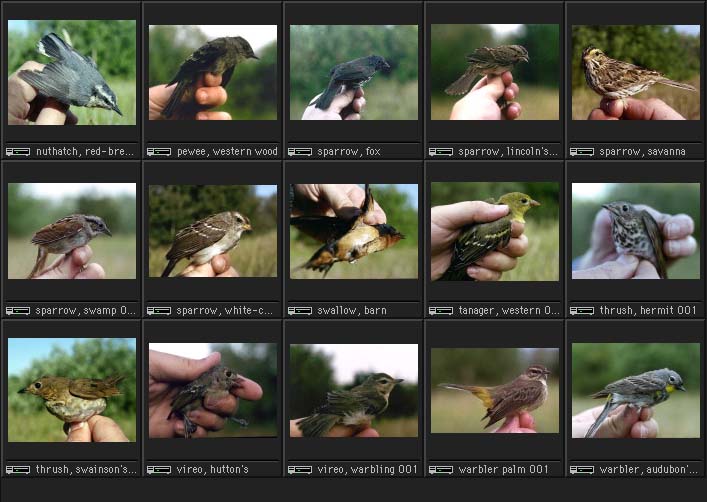
Photo
Album 02-nuthatch to warbler
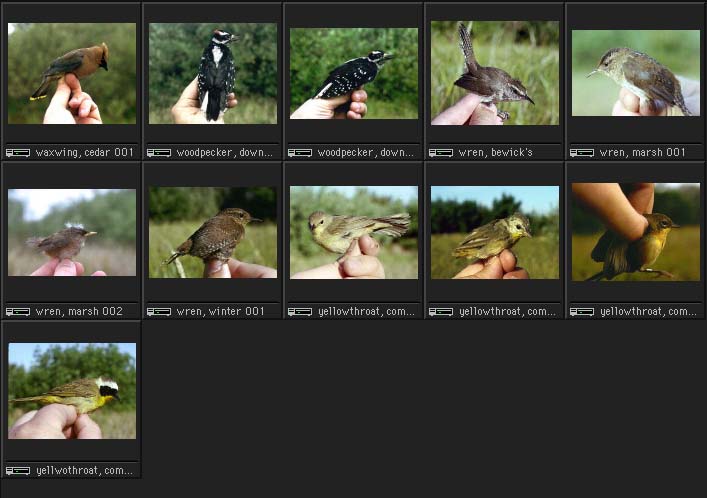
Photo
Album 03-warblers
Photo
Album 04-waxwing to yellowthroat
Graph 01-Total captures by year
Graph 02- Activity by time of day
Graph 03- Recaptures by percent of total captures
over successive years
Graph 04- Full moon and capture rate
Graph 05- Selected Spring warbler arrivals
Graph 06- Selected Fall arrival/departures
|
Number of spring captures
per year from 1989-1995 |
Graph 03 - Recapture rates for selected species
Graph 04 - captures relative to moon phases
Graph 05 - arrival patterns for selected neotropical migrants
Graph 06 - fall movement patterns for selected migrants
